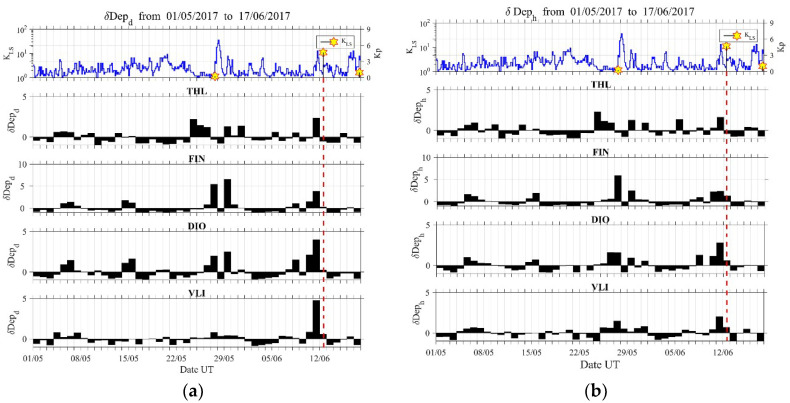
Figure 6.
Evolution of the ionospheric ULF quantity relative depression for the D (a) and H (b) horizontal components in all four observation sites. Top panel is similar to the top panel of Figure 3. Vertical dashed lines mark the time of occurrence of the 2017 Lesvos EQ. The most profound anomaly is observed for D component at VLI.

