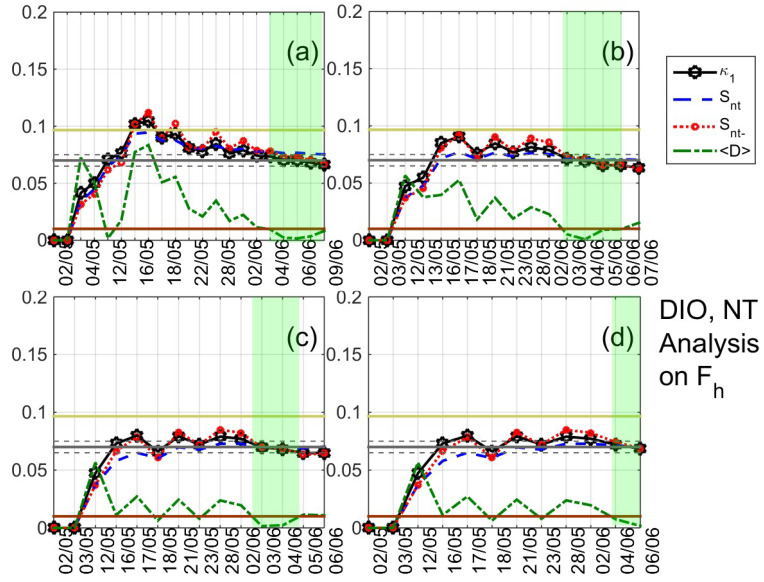
Figure 7.
Natural time analysis of at DIO: (a)–(d) Variations of the natural time (NT) analysis parameters (, , , and ) for the different thresholds , , , and , respectively. The entropy limit of , the value and a region of around it are shown by the horizontal solid light green, solid grey, and the grey dashed lines, respectively. Green patches highlight satisfaction of criticality conditions in the parts of the results which are used to reveal true coincidence. Note that the events employed depend on the considered threshold. Moreover, the time (x-) axis is not linear in terms of the conventional time of occurrence of the events, since the employed events appear equally spaced relative to x-axis as the NT representation demands, although they are not equally spaced in conventional time. (For the interpretation of the references to colors, the reader is referred to the online version of this paper).

