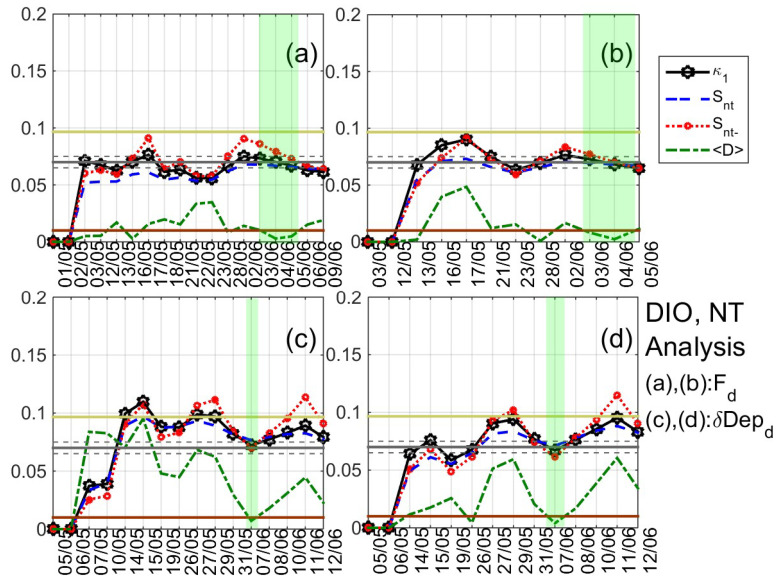
Figure 8.
Variations of the NT analysis parameters (, , , and ) corresponding to the analysis of at DIO for two threshold values (a) and (b), respectively, as well as of at the same station for two threshold values 0.1 (c) and 0.2 (d), respectively. Figure format is similar to Figure 7. (For interpretation of the references to colors, the reader is referred to the online version of this paper).

