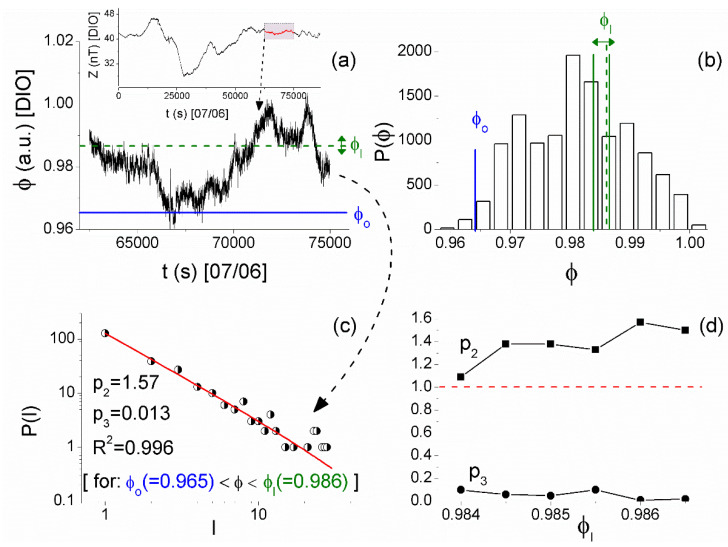
Figure 10.
(a) The normalized time series excerpt of the Z component of the magnetic field recorded at DIO station of ENIGMA that plays the role of the order parameter . The inset shows the corresponding part of the original time series recorded on 7 June 2017. (b) The histogram of values of , from which the start of laminar regions is determined, while the studied range of ends of laminar regions is also shown. (c) The distribution of the waiting times within the laminar region (laminar lengths) (the specific laminar region is also marked on the analyzed time series by the corresponding horizontal lines shown in (a)). The continuous red line corresponds to the fitted function . A clear power-law is identified. (d) The exponents vs. the end point . The validity of criticality condition for a wide range of end point values, and consequently for a wide range of laminar regions, is evident. (For interpretation of the references to colors, the reader is referred to the online version of this paper).

