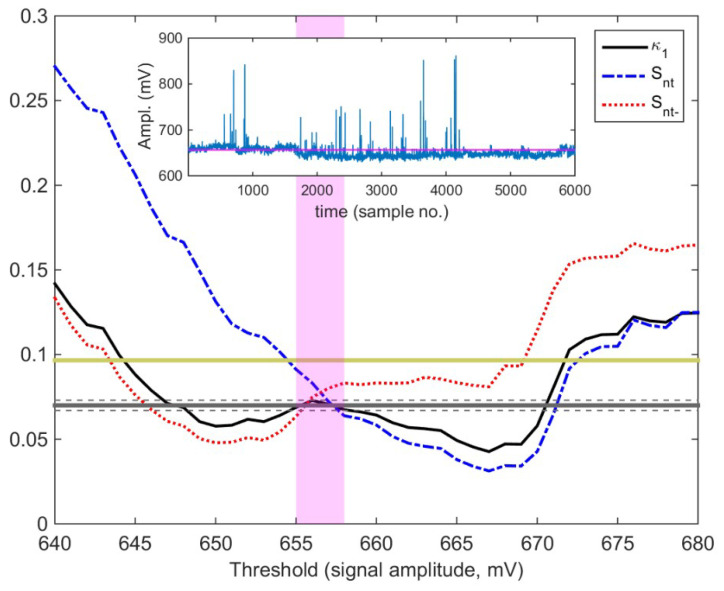
Figure 13.
The NT analysis quantities (solid curve), (dash-dot curve), and (dot curve) vs. amplitude threshold for the 41 MHz signal of Figure 12a (also shown in the inset). The entropy limit of , the value and a region of around it are denoted by the horizontal solid light green, solid grey, and the grey dashed lines, respectively. The vertical orthogonal magenta shaded area indicates the thresholds range for which criticality conditions according to the NT analysis method are satisfied. (For interpretation of the references to colors, the reader is referred to the online version of this paper).

