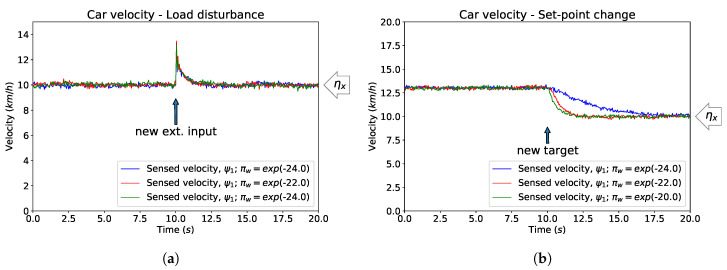
Figure 3.
Different responses to load disturbances and set-point changes. The simulations were 300 s long, with an external disturbance/different target velocity introduced at s. Here we report only a 20 s time window around the change in conditions. (a) The same load disturbance ( km/h) is applied with varying expected process precisions where . Expected sensory log-precisions are fixed over the duration of the simulations, with ; (b) A similar example for changes in the target velocity of the car, from km/h to km/h, tested on varying expected process precisions where .
| .5 | .5 |
| (a) | (b) |

