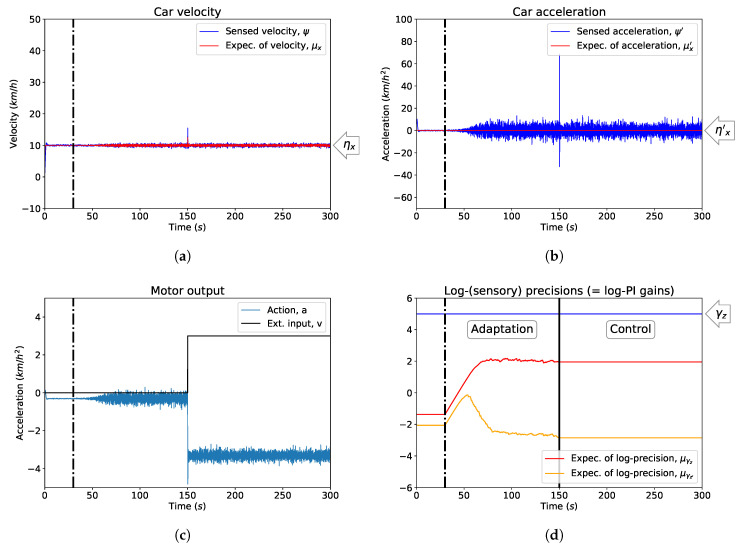
Figure 4.
Optimising PID gains as expected sensory log-precisions . This example shows the control of the car velocity before and after the optimisation of (before and after the vertical dash dot black line) is introduced. (a) The velocity of the car; (b) The acceleration of the car; (c) The action of the car, with an external disturbance introduced at s; (d) The optimisation of expected sensory precisions and their convergence to an equilibrium state, after which the optimisation is stopped before introducing an external force. The blue line represents the true log-precision of observation noise in the system, .
| .5 | .5 |
| (a) | (b) |
| .5 | .5 |
| (c) | (d) |

