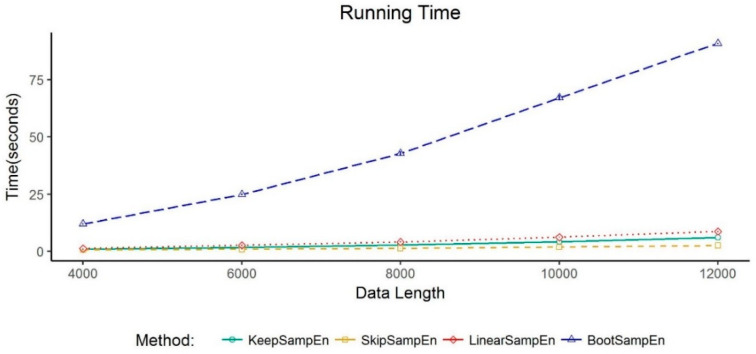
Figure 7.
Evaluation of the running time of four methods for handling missing values. Each method is run on five values of percentage of missing values (i.e., 10%, 20%, 30%, 40% and 50%) on the air flow dataset. The running time for them are summed up to be the total running time. This process is repeated 10 times. The average total running time for the 10 repeats is shown in the y-axis. Values are given as mean ± standard deviation. Note, the standard deviation is tiny so that it can hardly been seen in the figure.

