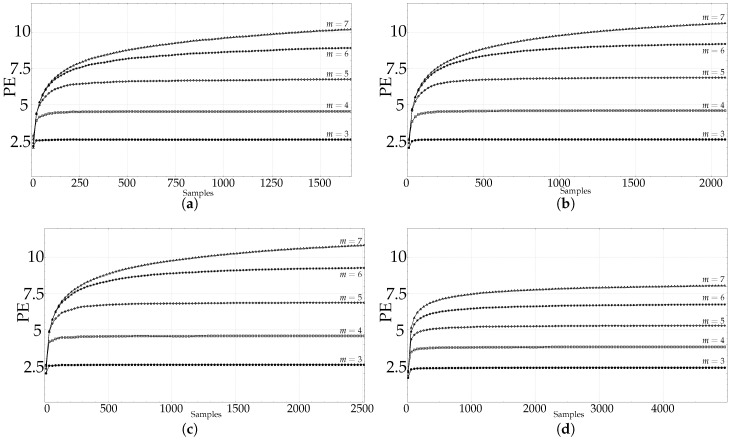
Figure 4.
Average PE evolution for real–world time series as a function of length N. (a) Average PE evolution for all the records in the CLIMATOLOGY database, with m from 3 to 7. Maximum length was 1500 samples. (b) Average PE evolution for all the records in the SEISMIC database, with m from 3 to 7. Maximum length was 2000 samples. (c) Average PE evolution for all the records in the FINANCIAL database, with m from 3 to 7. Maximum length was 2500 samples. (d) Average PE evolution for all the records in the EMG database (healthy, myopathy, neuropathy), with m from 3 to 7. Maximum length was 5000 samples.

