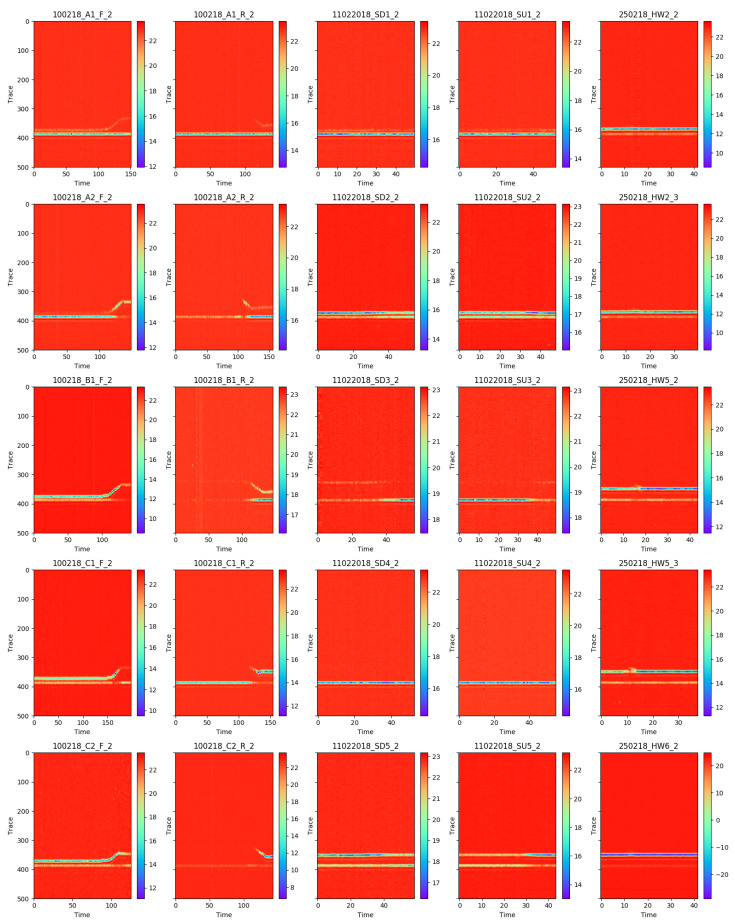
Figure 6.
Visualisation of the traces throughout time (x-axis). Columns correspond to different actions (respectively, forward walking, reverse walking, sitting down, standing up, and waving), whereas rows correspond to different examples. The titles on the subplots correspond to the sequence files in the dataset.

