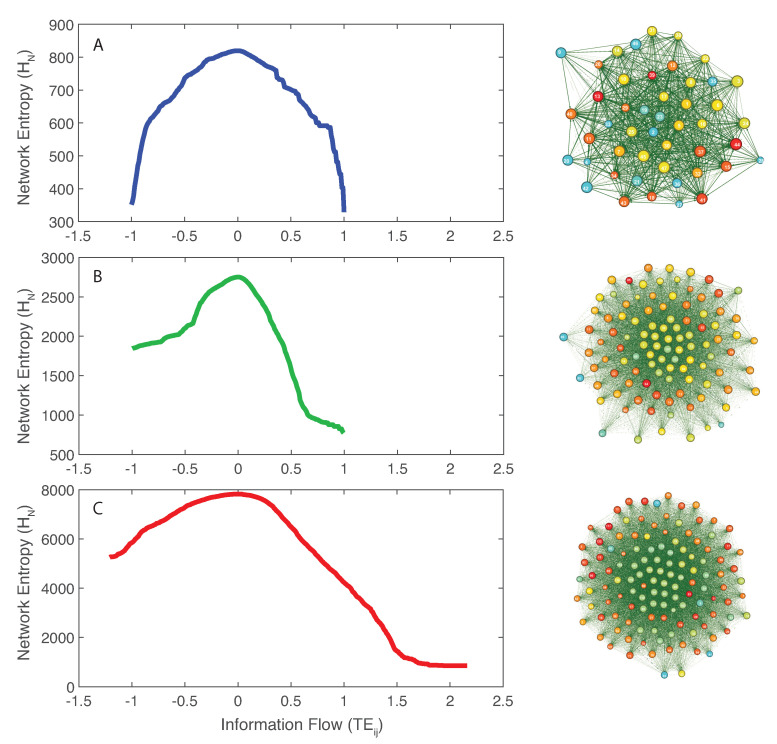
Figure 2.
Network entropy patterns and inferred Optimal Microbiome Networks. Network entropy dependent on the pairwise information flow () (left patterns) and extracted Optimal Information Networks for the microbiome on the right (Maximum Entropy Networks after node redundancy exclusion). A, B, and C: network entropy patterns for the healthy, transitory and unhealthy microbiome. The size of each node is proportional to the Shannon Entropy of the species; the color of the node is proportional to the structural degree (in Figure S3, the color of each node is proportional to the sum of total outgoing TEs of each node (OTE); the higher is the OTE, the warmer is the color); the distance is proportional to where is the mutual information between species RSA x and y; the width of each edge is proportional to the pairwise Transfer Entropy; and the direction is related to ; the direction of this edge is from i to j.

