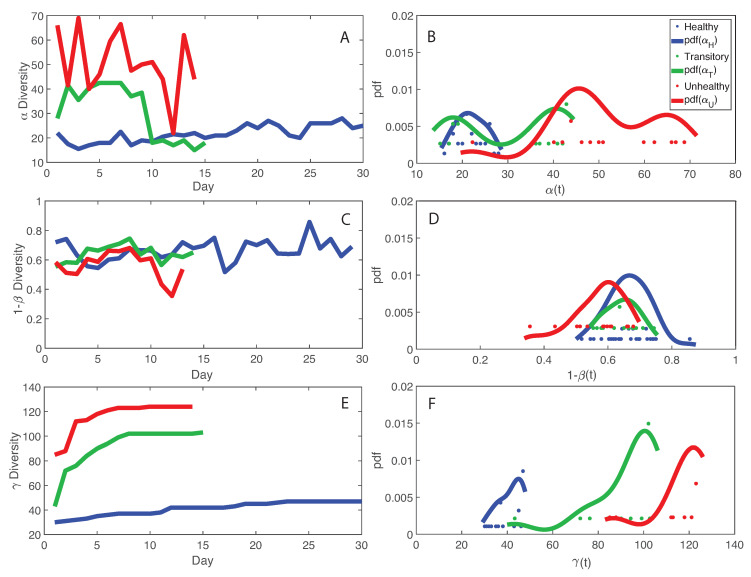
Figure 3.
Macroecological indicators of microbiome networks and probabilistic characterization. Average , species similarity , and total diversity are plotted as a function of time. Their probability distribution is shown on the right. A, C, and E: , , and diversity over time. B, D, and F: pdf of , , and diversity.

