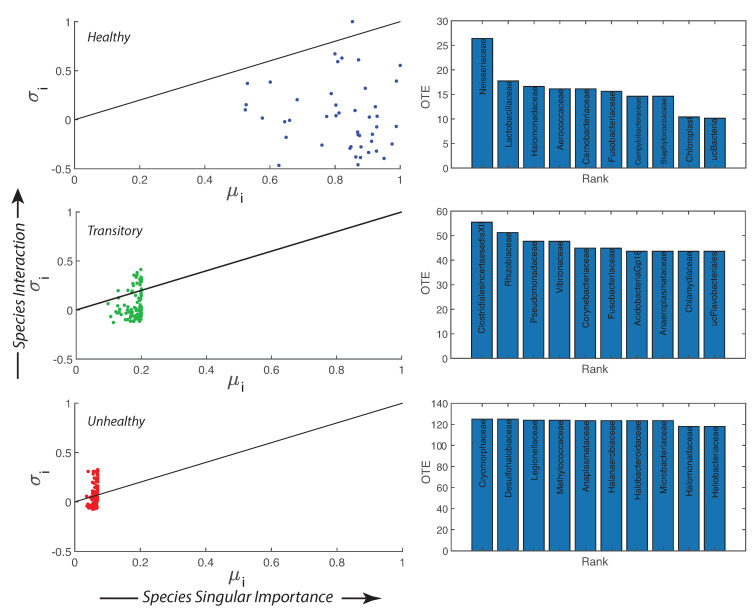
Figure 4.
Importance and interaction of microbial species, and top 10 most active species species. Transfer Entropy Indices: is describing species interaction and is calculated as the ratio between the total Outgoing Information Flow (OTE) () and the Total Network Entropy, while is describing the species importance as the ratio between the Nodal Entropy (Shannon Entropy) and the Total Network Entropy. The continuous line in each - plot (left) shows the critical edge that describes a state between regularity and chaos. On the right plots, the top 10 most active species in terms of OTE (and least relatively abundant) are ranked for the healthy, transitory and unhealthy microbiome (from top to bottom). These species are the most detrimental for the healthy group and the most beneficial for the unhealthy one.

