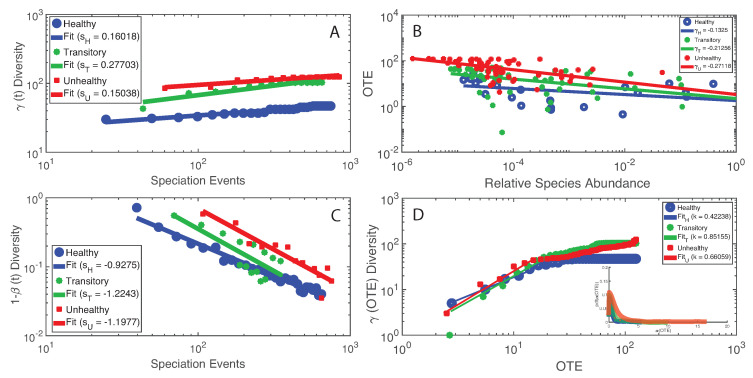
Figure 6.
Macroecological scaling patterns and predicted species interactions. (Left) The scaling of total -diversity and species similarity dependent on the number of speciation events (A and C) that is the number of new and existing species introduced until the time considered; speciation time is a proxy of the sampling area over time. (Right) The scaling of OTE vs. RSA (B) and -diversity vs. OTE (D) that consider the mutual variability of information exchange and macroecological indicators of the microbiome.

