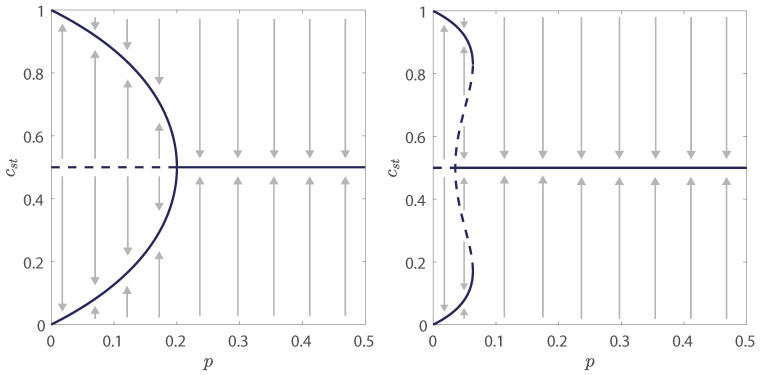
Figure 2.
Flow diagrams for and two values of : (left panel) and (right panel), which are the same values as in Figure 1. Here solid lines denote stable steady values of concentration , whereas dashed lines denote unstable values of . Arrows denote the direction of flow, i.e., how the concentration changes in time. Supercritical pitchfork bifurcation that corresponds to the continuous phase transition is seen in the left panel, whereas subcritical pitchfork bifurcation that corresponds to the discontinuous phase transition is seen in the right panel [28,39].

