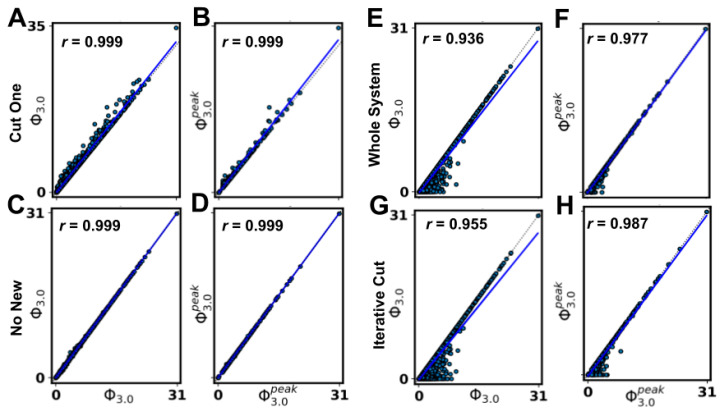
Figure 4.
Results of the comparison between Φ3.0 and approximations, with plotted linear fit (blue) and one-to-one relationship (dotted, gray); (A) Φ3.0 of the state-dependent CO approximation, (B) of the state-independent CO, (C) Φ3.0 of the state-dependent NN approximation, (D) of the state-independent NN. (E) Φ3.0 of the state-dependent WS estimated main complex, (F) of the state-independent WS, (G) Φ3.0 of the state-dependent IC estimated main complex, (H) of the state-independent IC.

