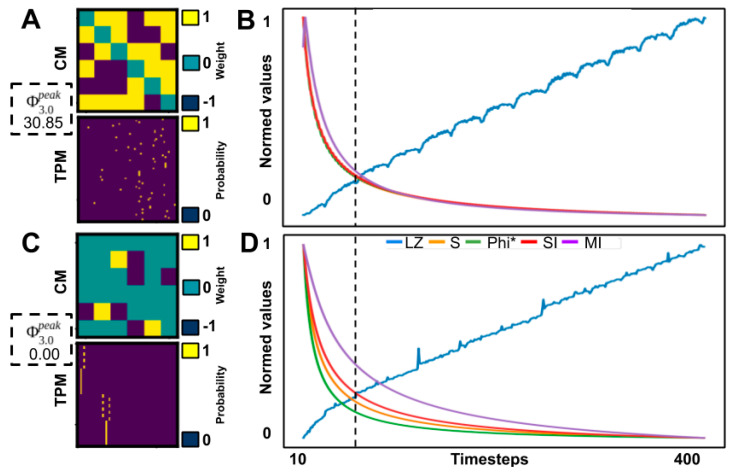
Figure A1.
Heuristics on generated time-series data, over varying number of timesteps, for two different six-node networks. (A) a high network with highly connected CM and complex TPM, (B) a low network with sparse connected CM and simple TPM, (C) normed values for different heuristics over timesteps between sampled timepoints for network A, (D) normed values for network B. The values for the two networks (B,D) were normalized between 0 and 1. In the original analysis, 64 timesteps were used (dashed line).

