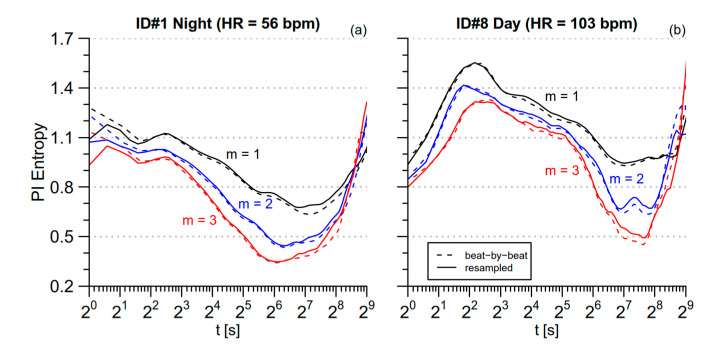
Figure 3.
Modified Multiscale entropy for the original and the evenly oversampled beat-by-beat series. Estimates are shown for segments of 214 s and for three embedding dimensions. Estimates on the beat-by-beat series (dashed lines) are plotted vs. the scale t, in seconds, calculated by multiplying τ in beats by the mean PI, in seconds; estimates after interpolation and oversampling at 2 Hz (continuous lines) are plotted vs. the scale t, in seconds, calculated dividing τ, in number of samples, by the sampling frequency, in Hz; (a) the most bradycardic segment, during nighttime sleep; (b) the most tachycardic segment, during daytime activities.

