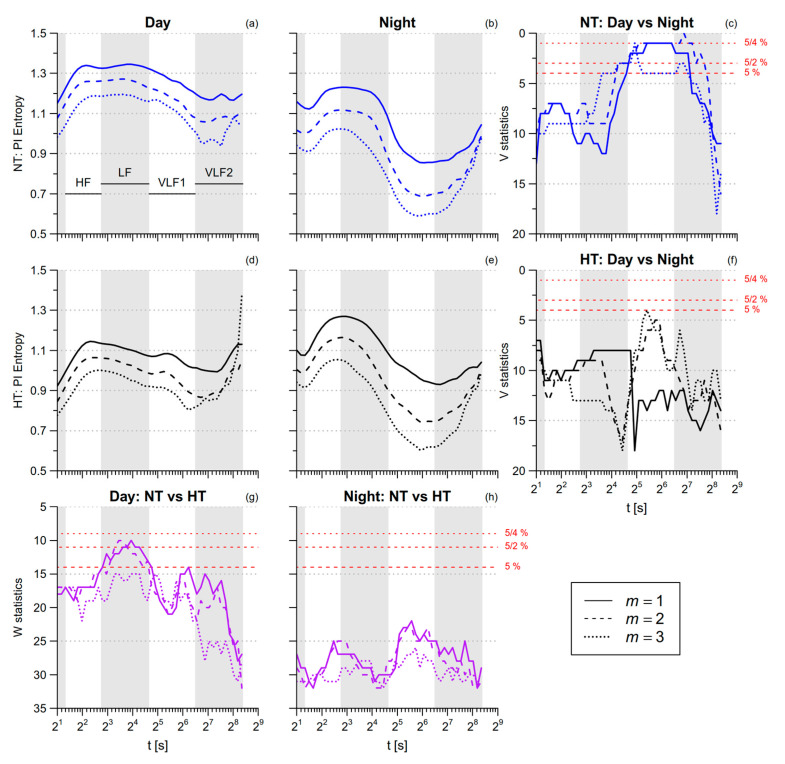
Figure 6.
Multiscale Sample Entropy of PI in normotensive (NT) and hypertensive (HT) groups, during day and night conditions. Average modified multiscale entropy mMSE(t) over eight NT and eight HT participants during nighttime sleep (panels (b,e)) or daytime activities (panels (a,d)), for embedding dimensions m between one and three; as a reference, gray bands in each panel show the ranges of scales corresponding to the high-frequency (HF), low-frequency (LF), and very-low-frequency (VLF) bands of traditional spectral analysis (with VLF = VLF1 + VLF2, see text). Panels (c,f): Wilcoxon signed-rank statistics V for the comparison between conditions, separately in NT and HT groups; panels (g,h): Wilcoxon rank–sum statistics W for the comparison between groups, separately in day and night conditions. The lower red horizontal line is the 5th percentile of the V or W distributions: when the distribution is above this threshold, the difference is statistically significant at p < 5% and the hypothesis of similar entropies for a given condition and a given group is rejected; the intermediate red horizontal line corresponds to the same significance threshold after Bonferroni correction for two comparisons (NT vs. HT for both conditions, day vs. night for both groups); the upper red line corresponds to the Bonferroni correction of the statistical threshold for all the four comparisons simultaneously.

