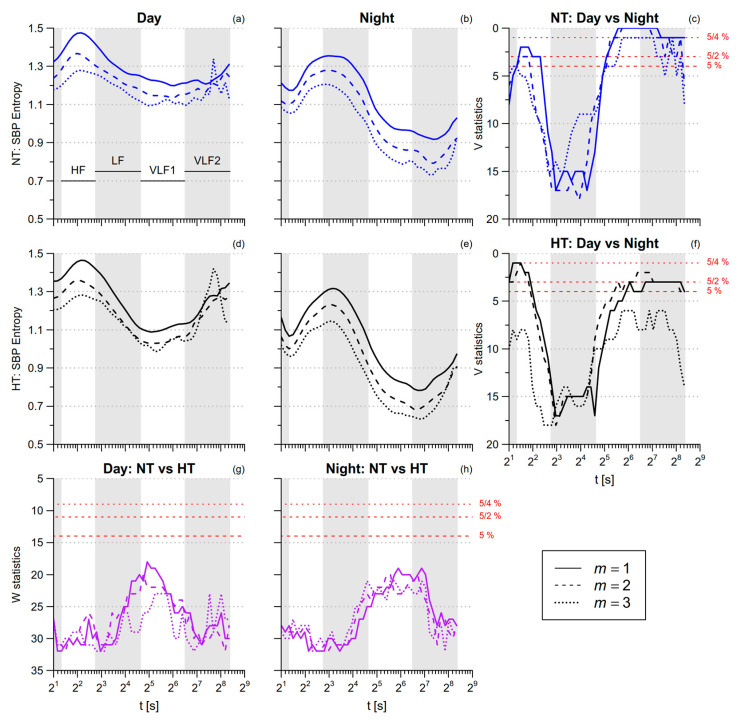
Figure 7.
Multiscale Sample Entropy of SBP in normotensive (NT) and hypertensive (HT) groups, during day and night conditions. Panels (a,b,d,e): average mMSE(t) by groups and conditions for 1 ≤ m ≤ 3. Panels (c,f): signed-rank statistics V for the comparison between conditions; Panels (g,h): rank-sum statistics W for the comparison between groups. See also Figure 6.

