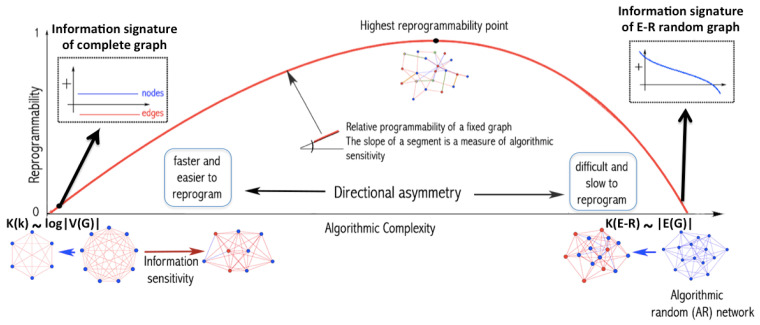
Figure 2.
Graphs as produced by programs. All real-world networks lie between the extreme cases of being as simple as a complete graph whose algorithmic complexity C is minimal and grows by only , and a random (also statistically random and thus E-R) graph whose algorithmic complexity is maximal and grows by its number of edges . If we ask what it takes to change the program producing k to produce and vice versa, in a random graph, any single algorithmic-random node or edge removal does not entail a major change in the program-size of its generating program, which is similar in size to the random graph itself, i.e., . The curve shows how, without loss of generality, the reprogramming capability of networks, as produced by computer programs, produces an asymmetry imposed by algorithmic complexity and reminiscent of traditional thermodynamics as based on classical probability. A maximally random network has only positive (blue) elements (Figure 3 and Figure 4) because there exists no perturbation that can increase the randomness of the network either by removing a node or an edge, as it is already random (and thus non-deterministic). Thus, changing its (near) minimal program-size length by edge or node removal is slow. However, a simple graph may have elements that incline its program-size length toward randomness. In each extreme case (simple vs. random), the distribution of sorted elements capable of shifting in each direction is shown in the form of what we call “signatures”, both for algorithmically random edge and node removal. The highest reprogrammability point is the place where a graph has as many elements to steer it in one direction as in the other.

