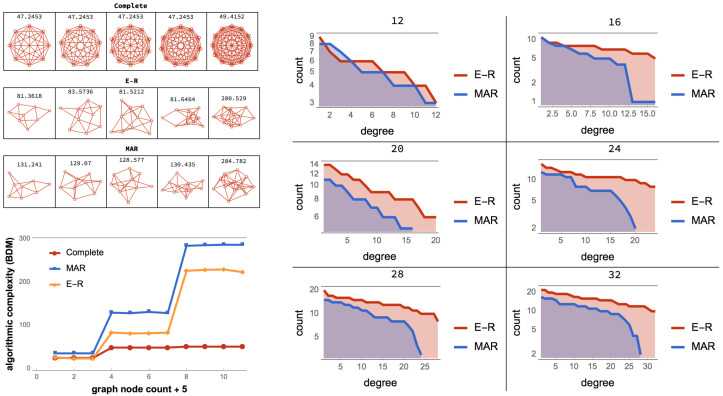
Figure 5.
(Top left) One can produce a MAR graph starting from an empty graph and adding one edge at a time (see Figure 6) or one can start from a complete graph and start deleting edge by edge keeping only those that maximise the algorithmic randomness of the resulting graph. (Bottom left) Following this process, MAR graphs top E-R graphs meaning BDM effectively separate low algorithmic complexity (algorithmic randomness) from high entropy (statistical randomness), where entropy would simply be blind collapsing all recursive and non-recursive cases. (Right) degree distribution comparison between E-R and MAR graphs.

