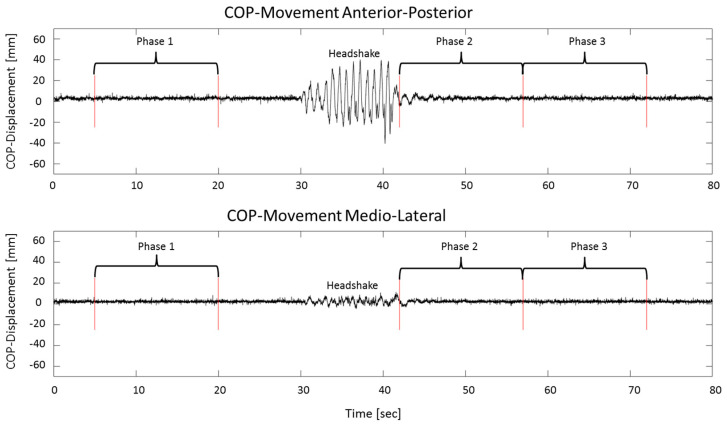
Figure 1.
Center-of-pressure (COP) data of one sample trial of an anterior–posterior head shake with open eyes. The graph on top shows the anterior–posterior COP movement, the bottom graph shows the medio-lateral COP movement. The three analyzed phases are indicated. The last 50 s were omitted to better visualize the relevant phases of the trial.

