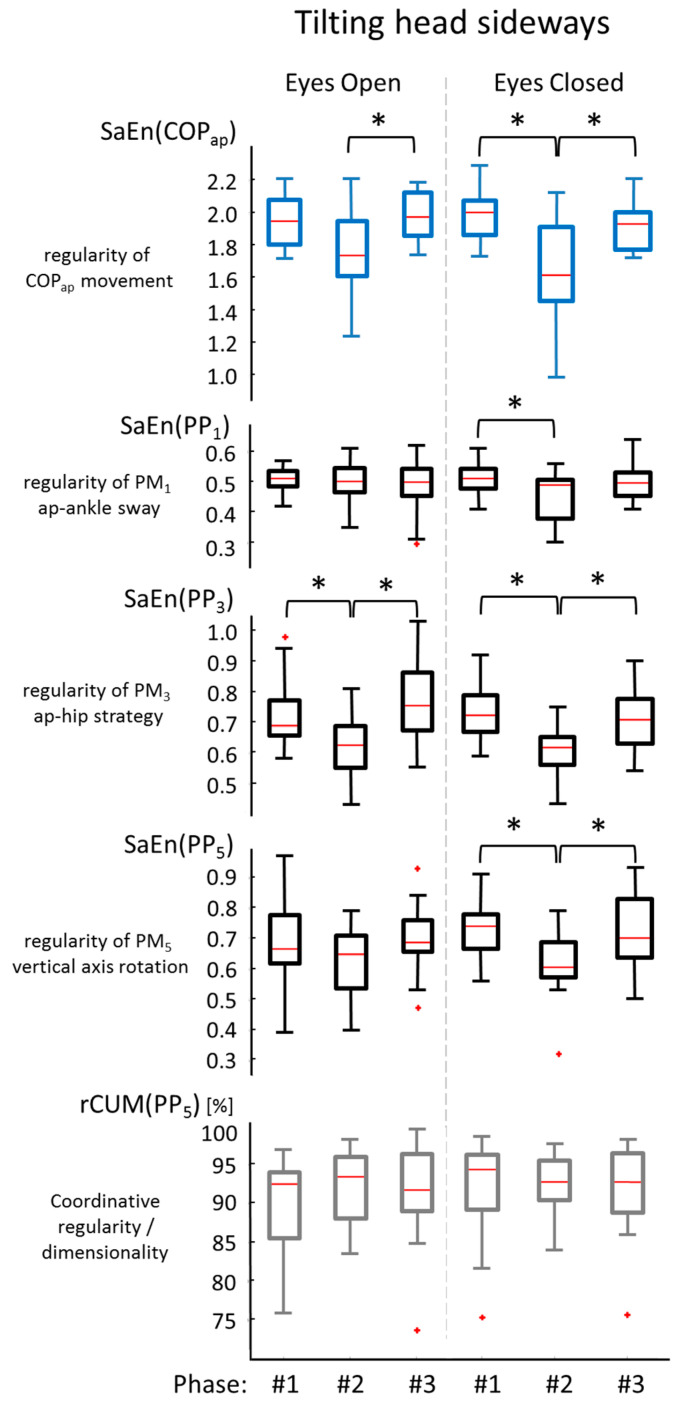
Figure 3.
Results of the trials where participants tilted their heads sideways, with a focus on the variables representing the anterior–posterior movement of the body. The boxplots on top show the SaEn(COPx) values as seen in Figure 2. The three graphs below represent the SaEn(PPk) values of movement components substantially contributing to anterior–posterior postural movements. Significant differences are indicated (*). The bottom graph represents coordinative complexity characterized through rCUM(PP5). No significant effects were observed in this data.

