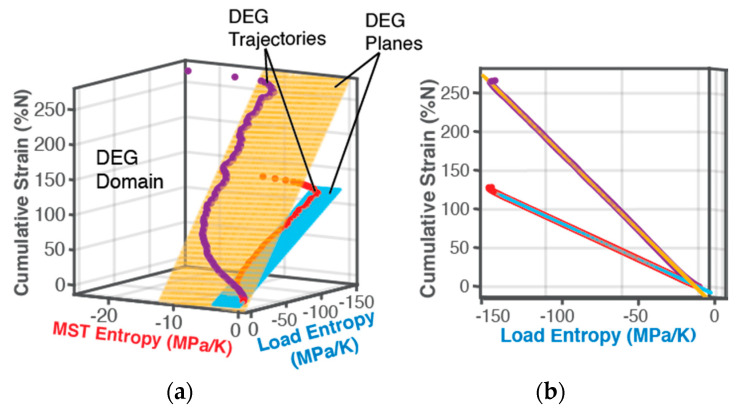
Figure 6.
3D plots and linear surface fits of cumulative strain vs load entropy and MST entropy during cyclic bending (red points, blue plane) and torsion (purple points, orange plane) of SS 304 steel sample, showing in (b) a goodness of fit of R2 = 1, indicating a linear dependence on the 2 active processes. In (a), loading trajectories start from lowest corner. (Axes are not to scale and colors are for visual purposes only).

