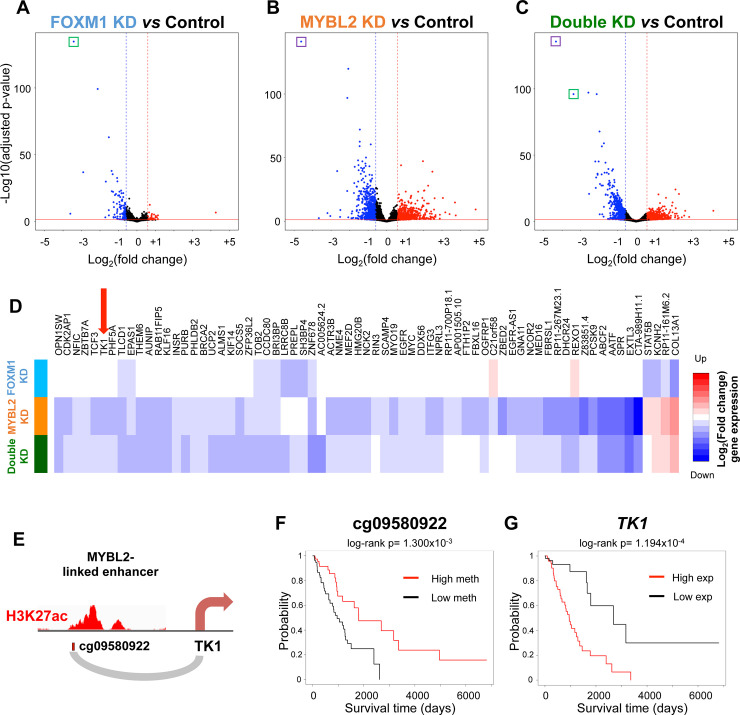
Fig 8. Identification of genes regulated by FOXM1 and MYLB2.
Volcano plots showing gene expression changes after knocking down (A) FOXM1 or (B) MYBL2 or (C) Double (both FOXM1 and MYBL2). The knocked down genes (FOXM1 or MYBL2) are highlighted by a green or purple box, respectively. (D) Heatmap displaying fold change expression of significantly downregulated genes in the vicinity of cancer-specific enhancers associated with poor patient survival after FOXM1 (light blue) or MYBL2 (orange) or double (green) knockdown; log2(fold change) were plotted from dark blue to dark red (see S9 Table). Genes shown represent potential target genes within 1 Mb of CENPA/FOXM1/MYBL2-linked enhancers whose activation is significantly associated with poor patient survival. Expression of the gene TK1 is highlighted by the red arrow. (E) Diagram of A549 H3K27ac mark overlapping the MYBL2-linked probe cg09580922 and its potential target gene TK1 (see S10 Fig). (F) Kaplan-Meier survival plot comparing differences in survival between LUAD tumor samples with the highest and lowest quartiles of cg09580922 methylation. (G) Kaplan-Meier survival plot comparing differences in survival between LUAD tumor samples with the highest and lowest quartiles of TK1 expression.

