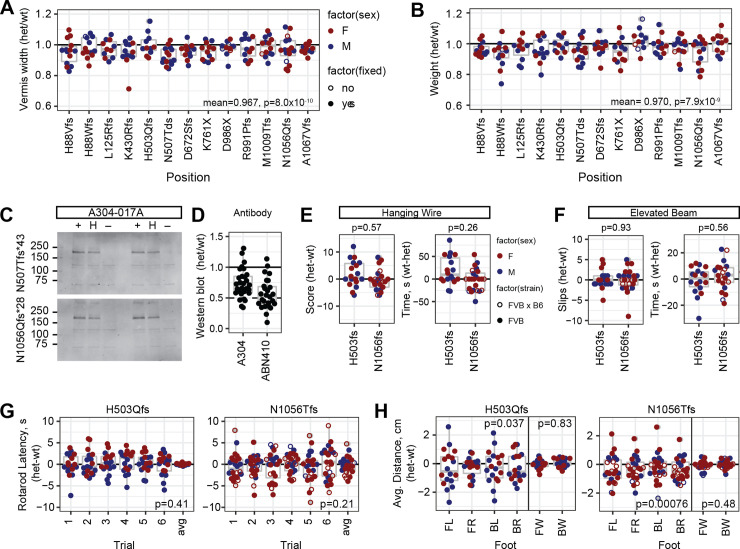
Fig 3. PTC heterozygotes have mild haploabnormalities.
(A) Vermis width in heterozygotes for individual protein-negative PTC variants relative to control littermates. Y-axis was shifted relative to Figs 1 and 2 to emphasize distribution within the range of observed values. Bottom right corner, mean and p-value for all PTC heterozygotes, combined N = 165, one-sample t-test for true ratio = 1. (B) Weight at sacrifice, combined N = 163. (C) Western blots showed reduced steady-state level of Zfp423 protein in neonatal cerebellum of PTC heterozygotes relative to reference littermate. (D) Normalized values among PTC heterozygotes with independent antibodies showed typical values between 0.5 and 1 relative to control littermates in neonatal cerebellum. (E-H) Behavioral tests for locomotor coordination on littermate pairs for two PTC heterozygotes, H503Qfs*11 (N = 18) and N1056Qfs*29 (N = 24), either coisogenic on FVB (filled circles) or as B6xFVB F1 hybrids (open circles). (E) Hanging wire task performance scores and fall latencies. Wilcoxon signed rank test, N = 43. (F) Elevated beam escape task. (G) Rotating rod fall latencies across six successive trials per pair and average ratio across all six trials. P-value is one-sample t-test for average difference being 0. (H) Footprint analysis for stride length in each paw and width between left and right paws. FL front left, FR front right, BL back left, BR back right, FW front paw stride width, BW back paw stride width. P-values for one-sample t-tests for average differences equal to 0.

