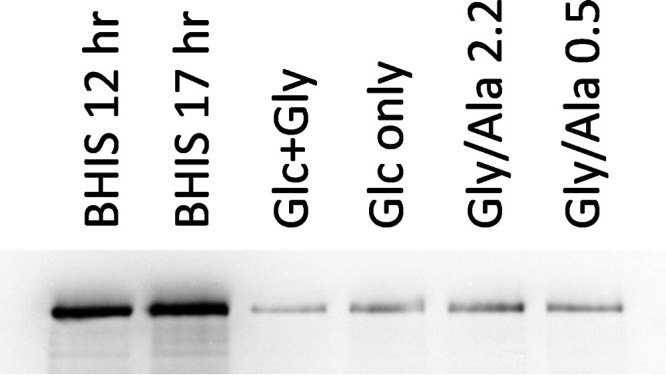
FIG 10.

Relative TcdA toxin levels in cells grown in BHIS and in defined media. Cell extracts prepared from the large-scale growths indicated were analyzed by SDS-PAGE on an 8% acrylamide gel with equivalent amounts of protein, 37.5 μg, applied per lane. The loading pattern was the same as for Fig. 6. Western blot analysis employed mouse monoclonal anti-TcdA as the primary antibody and was developed and imaged as indicated in Materials and Methods. Relative TcdA band intensities were 10.8, 13.0, 1.00, 1.66, 2.11, and 1.55 for the BHIS 12 h, BHIS 17 h, Glc+Gly, Glc-only, Gly/Ala 2.2, and Gly/Ala 0.5 extracts, respectively.
