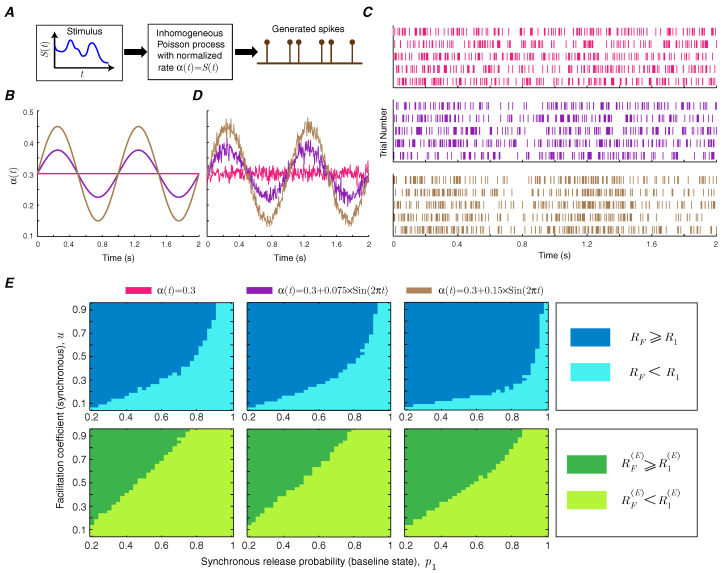
Figure 6.
(A) Generation of correlated spike trains. (B) Sinusoidal stimulus signals, with a frequency of 1 Hz, average value of 0.3, and amplitudes 0, , and , are used as the normalized rate of the inhomogeneous Poisson process. (C) The spike raster plots of the simulated neurons (5 trials for each amplitude). (D) The estimation of the instantaneous neuronal firing rate from 1000 trials. (E) Functional classes of short-term facilitation for correlated input. The first column corresponds to the uncorrelated input () and the second and third columns correspond to the correlated spike trains generated by sinusoidal stimulus signals with amplitudes and . The other simulation parameters are , , , and .

