Figure 5.

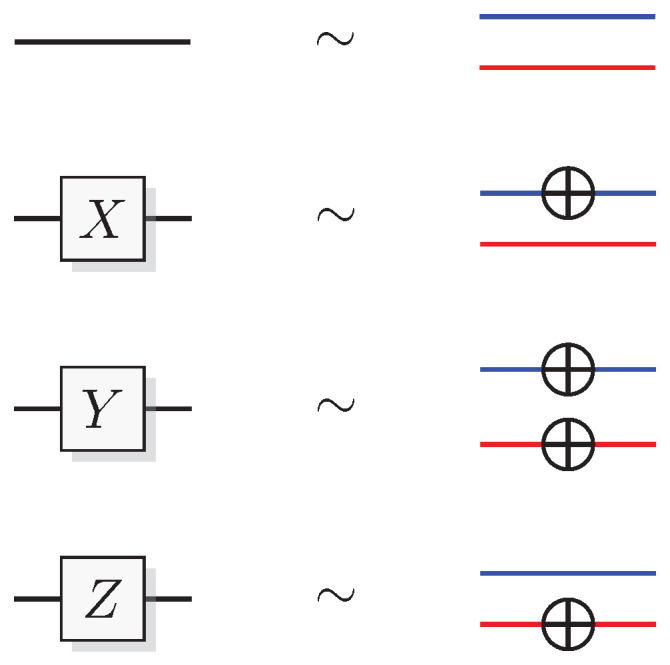
Graphical representation of the simulation of the Pauli gates and Z. Blue line segments represent the computational bit and red represents the phase bit.

Graphical representation of the simulation of the Pauli gates and Z. Blue line segments represent the computational bit and red represents the phase bit.