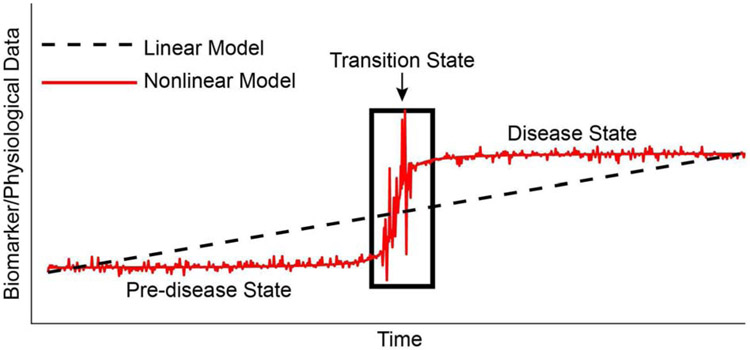
Figure 1: Schematic of the nonlinear evolution of disease.
The black line represents the linear model of disease whereby disease progression happens uniformly and in a constant manner to the disease state. The red curve represents the nonlinear evolution of disease whereby a stable pre-disease state undergoes a rapid transition (transition state) to a disease state. Intervention at the transition state may result in better outcomes.

