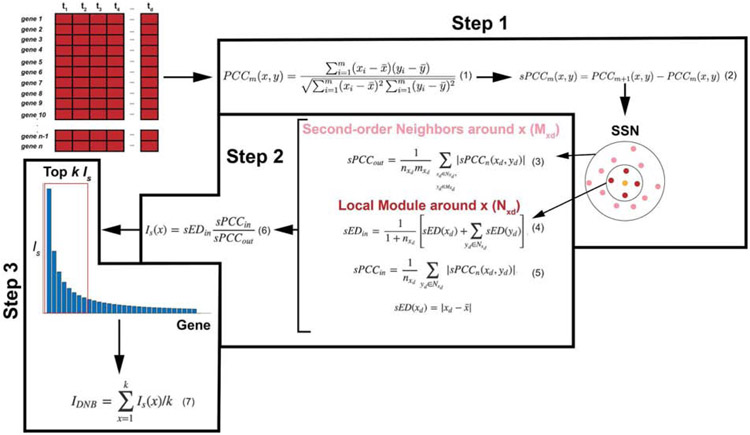
Figure 3: Outline of the steps to the landscape DNB method.
The l-DNB ethod takes as input a gene-expression data set. Step 1 calculates Pearson (PCCm) and differential Pearson correlation coefficients (sPCCm) to construct a single sample network (SSN) around gene x. The SSN is separated into first-order neighbors of gene x, Nxd (with nxd genes), and second-order neighbors, Mxd (with mxd genes). Next, based on the SSN found in Step 1, Step 2 computes local DNB values for each gene. sPCCin is the average absolute sPCCm value between gene x and its first-order neighbors. sPCCout is proportional to the average absolute value of sPCCm between gene x and its first-order neighbors and the second-order neighbors. sEDin is the average deviation in expression of gene x and all its first-order neighbors. Is(x) is the local DNB score of gene x. Finally, Step 3 ranks all local DNB scores and takes the average of the top k values to compute a global DNB score, IDNB.

