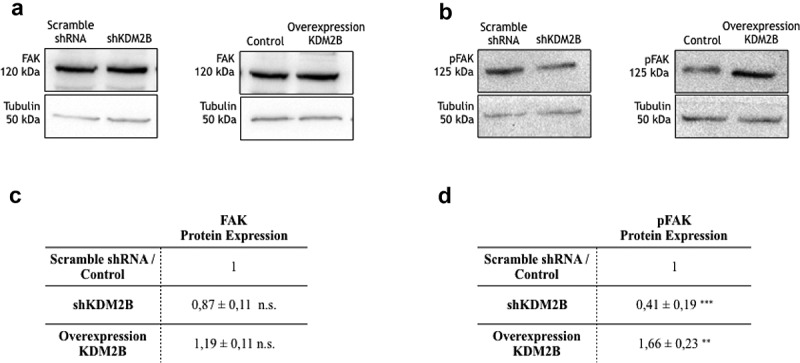
Figure 2.

Detection of protein expression via western blotting. Western Blot analysis of (a) FAK and (b) pFAK protein expression in HCT-116 cell clone lysates. Statistical data of (c) FAK and (d) pFAK protein expression levels in HCT-116 cell clone lysates. Each value is the mean ± SD from n = 4 experiments. Data are normalized using tubulin as an immunoblot loading control. n.s. indicates nonstatistical significance, **(p ≤ 0.01), ***(p ≤ 0.001) indicates statistical significance.
