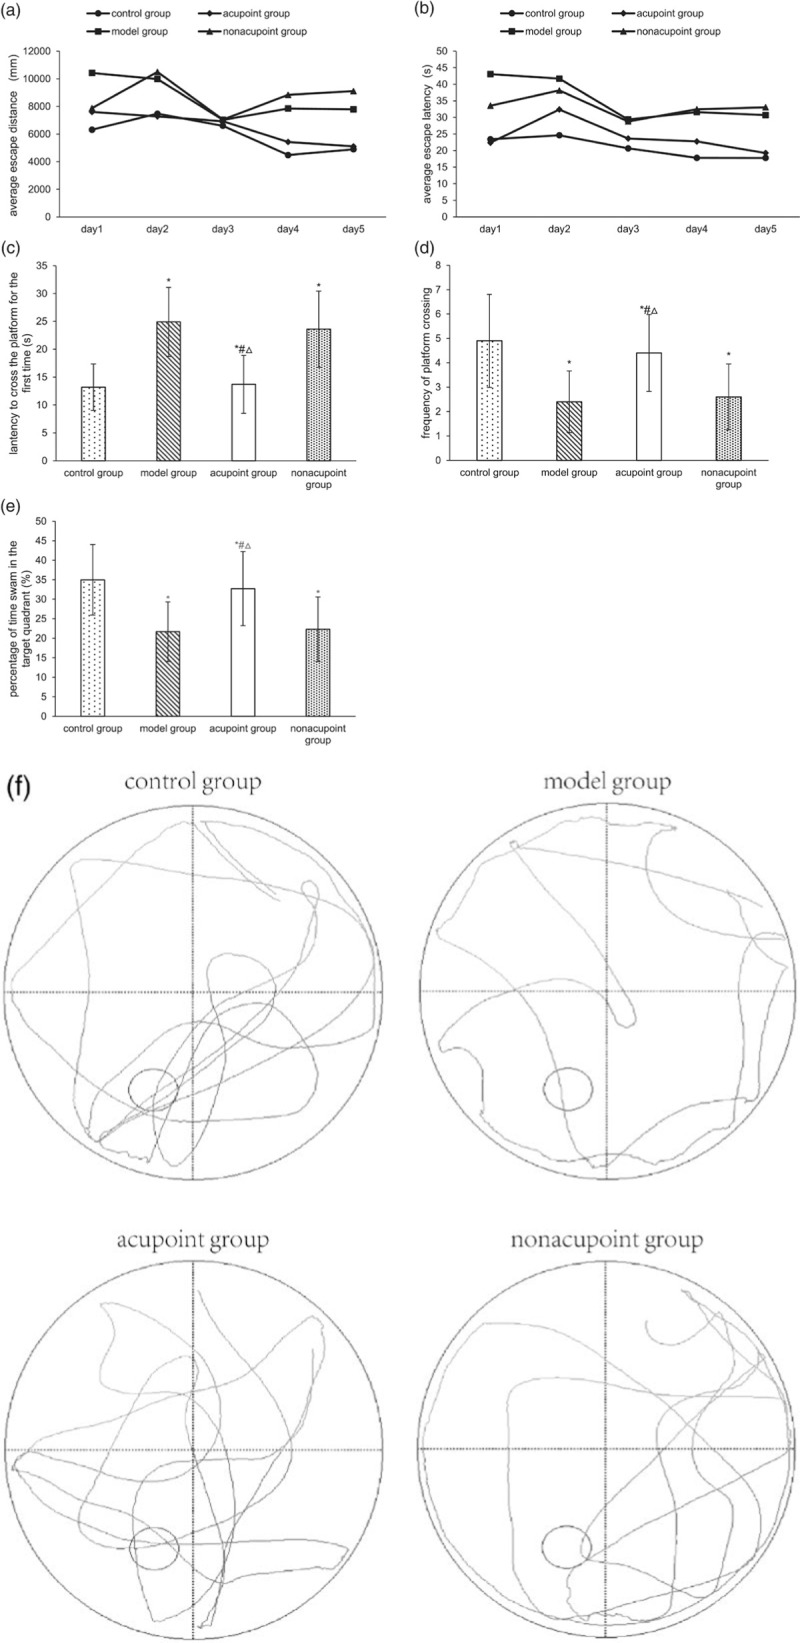
Fig. 3.

Morris water maze. The average escape distance (a) and average escape latency (b) in the acquisition trials. The latency to cross the platform for the first time (c), the frequency of platform crossing (d) and percentage of time swam in the target quadrant (e) in the probe trial. *P < 0.05 vs. the control group, #P < 0.05 vs. the model group, △P < 0.05 vs. the nonacupoint group. (f) Representative swimming paths during the probe trial of the MWM test.
