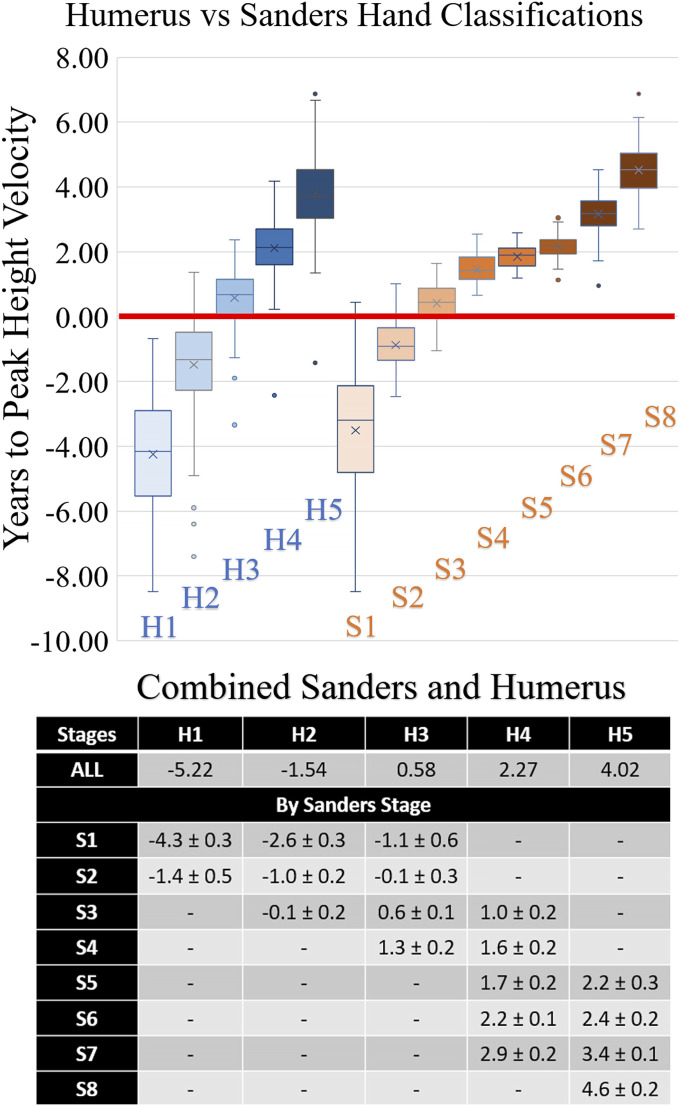
Fig. 2.
Top: Box-and-whisker plots depicting the relationship of both the humeral and Sanders systems to PHV. The top and bottom of a box indicate the interquartile range (IQR), the line within the box indicates the median, the X indicates the mean, the whiskers indicate values within 1.5 IQR of the box, and the circles represent outliers. The systems were then combined into pairs of stages that had sufficient data to make an accurate prediction. All graphs depict the same set of data that was used in this analysis. The stages represent the humeral system alone (H1, H2, H3, H4, H5), the Sanders system alone (S1, S2, S3, S4, S5, S6, S7, S8), and the combined system (H1S1, H2S1, H1S2, H3S1, H2S2, H3S2, H2S3, H3S3, H4S3, H3S4, H4S4, H4S5, H5S5, H4S6, H5S6, H4S7, H5S7, H5S8). The horizontal red line represents PHV. Bottom: In the accompanying table, the mean and 95% confidence levels for each combination of humeral and Sanders stages were calculated relative to PHV in years. All data that had a complete set of information for all 3 variables were included in these calculations. A dash indicates that insufficient radiographs fell into these categories for accurate predictions and therefore the data were removed from the analysis.

