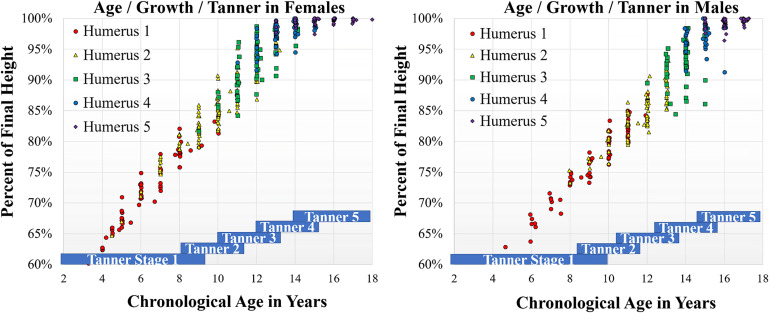
Fig. 3.
Charts demonstrating the relationship between chronological age and percentage of final height for males and females. Each radiograph was assessed for humeral stage and was plotted with regard to the chronological age and percent of final height of the patient during that presentation. The radiographs were color-coded by humeral stage as depicted. Both charts are on the same scale and use the same color scheme. Tanner stages were depicted on the basis of the means and standard deviations established in previous literature as described in the Results section.

