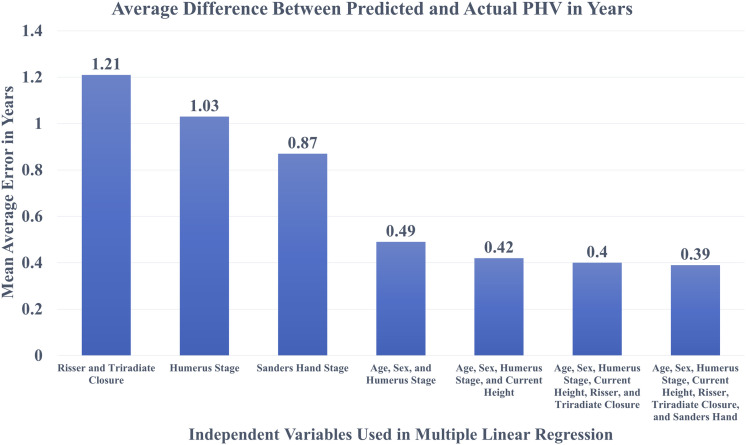
Fig. 4.
Bar graph comparing mean absolute errors between each linear regression equation, with smaller absolute errors indicating better predictions from the corresponding model. For example, a model that consistently made predictions that were 1 year off from the true PHV would have a mean absolute error of 1.00, whereas a model that made perfectly accurate predictions would have a mean absolute error of 0.00. Risser sign, triradiate closure, humeral stage, age, sex, current height, and Sanders hand stage are the independent variables that were included in the indicated combinations for the models.

