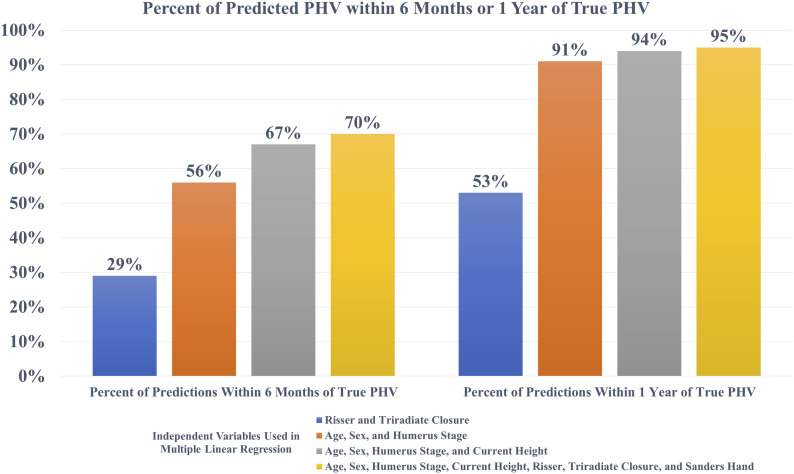
Fig. 5.
Bar graph showing the percentage of predictions that were accurate to within 6 months or 1 year of the true PHV measured from the patient. The height of the bar indicates the percentage of predictions that were accurate within the given time frame. For example, a model that was perfectly accurate would have a value of 100%. Risser sign, triradiate closure, humeral stage, age, sex, current height, and Sanders hand stage are the independent variables that were included in the indicated combinations for the models.

