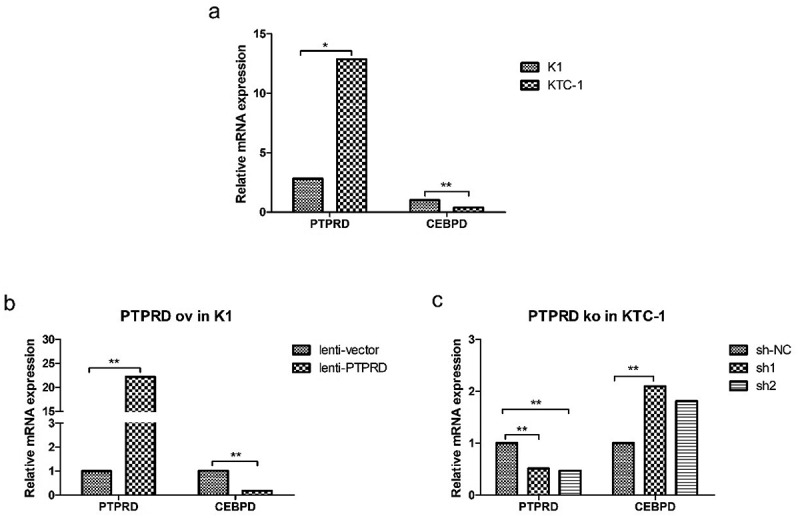
Figure 2.

Negative correlation of PTPRD levels and CEBPD expression. (a) PTPRD and CEBPD expression in K1 and KTC-1 cells by qRT-PCR analysis. (b) CEBPD expression after PTPRD was overexpressed in K1 cell. (c) CEBPD expression after PTPRD was knocked down in KTC-1 cell. Data were representative of experiments in triplicate. *P <.05, **P <.01.
