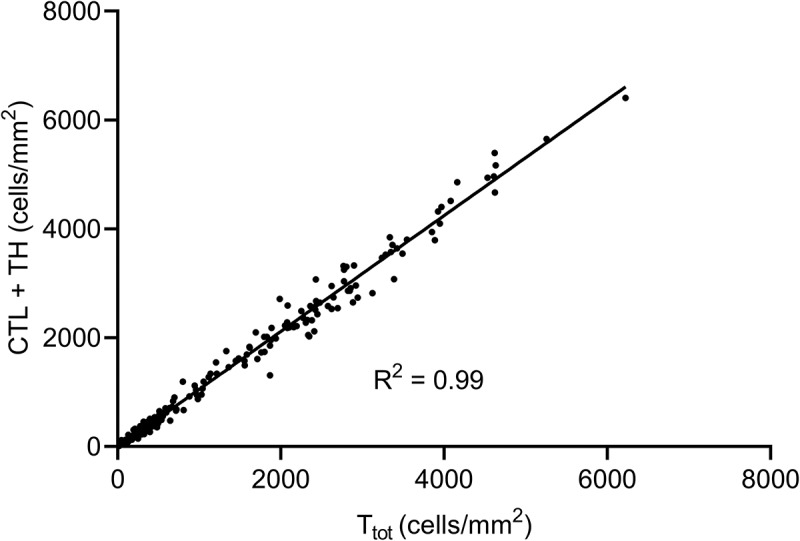
Figure 1.

Scatter plot showing the correlation between the total number of T-cells (Ttot) and the sum of cytotoxic and helper T-cell subtypes (CTL and TH) in all tumor regions and adjacent liver tissue. The diagonal line indicates linear regression analysis (R2 = 0.99), suggesting that CTL and TH corresponded well to Ttot.
