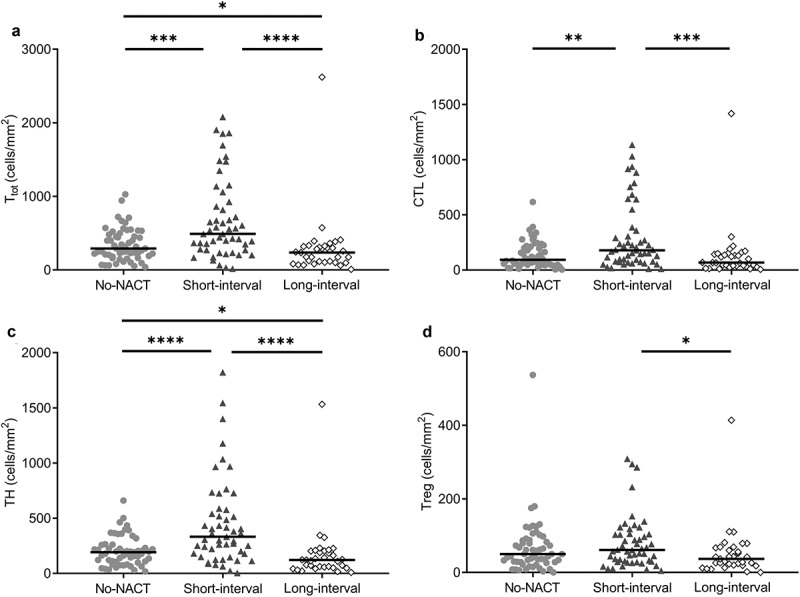
Figure 2.

Dot density plots of intratumoral T-cell densities (cells/mm2) in the NACT subgroups.
Light gray circles, No-NACT group (n = 57 tumors); dark gray triangles, short-interval group (n = 54 tumors); and open circles, long-interval group (n = 33 tumors). Group median is indicated by the horizontal lines. Subgroups are compared pairwise, and significant differences are indicated: *, P < .05; **, P < .01; ***, P < .001; ****, P < .0001. a) Ttot, total amount of T-cells, b) CTL, cytotoxic T-cells, c) TH, helper T-cells, d) Treg, regulatory T-cells
