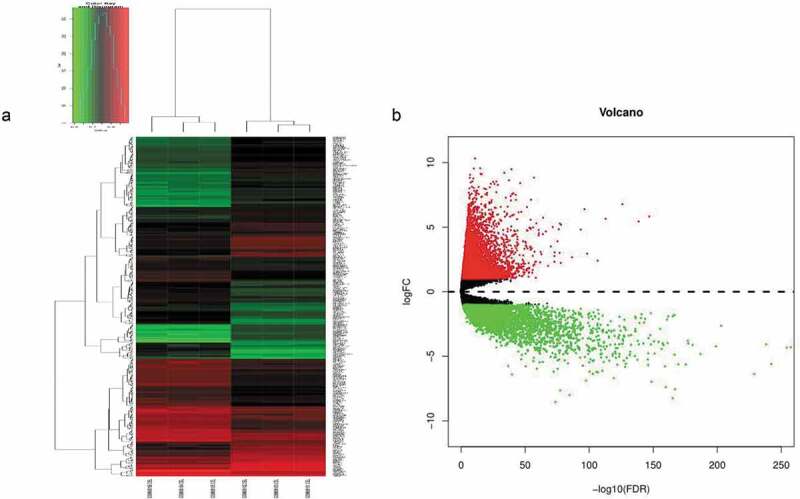
Figure 1.

(a) Unsupervised hierarchical clustering analysis of the differentially expressed mRNAs between CD133- and CD133+ Caco-2 cells. (b) The differentially expressed genes between CRC and normal tissues, in which red indicates high expression, and green indicates low expression.
