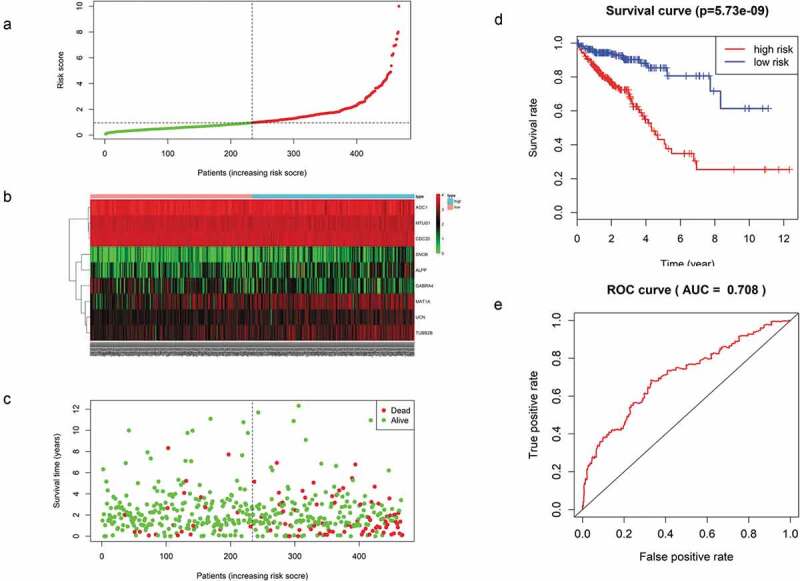
Figure 5.

(a) Distribution of mRNA-related RSs in patients. (b) The expression heatmap of nine prognostic mRNAs. (c) The mortality of patients with an increase in the RS. (d) K-M survival curve analysis for the OS of CRC patients using the nine-mRNA signature. (e) ROC curve analysis of the nine-mRNA signature.
