
Figure 1.
Selection of for target cells and construction of effector cells.
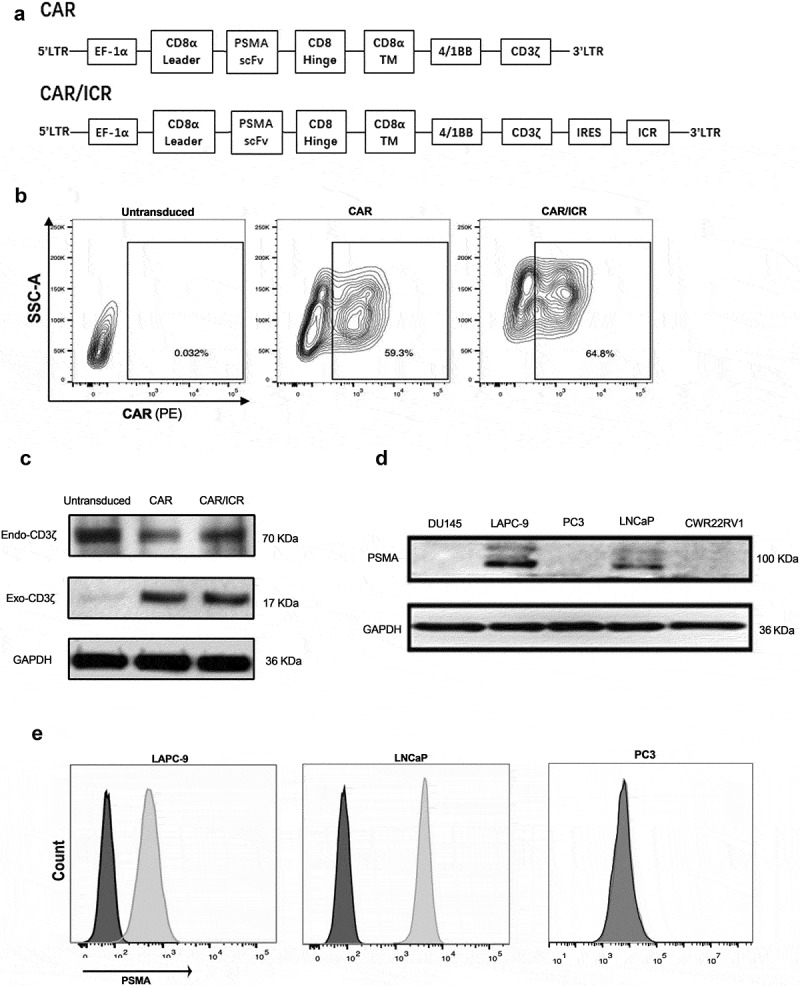
a. Gene structure of effector cell CAR. b. The positive rate of CAR-T cells measured by flow cytometry 5 days after T cell transfection. c. CD3ζ detected by western blot. Exogenous CD3ζ was presented as a 70 kD band only in the lanes of CAR-T cells, and endogenous CD3ζ was presented as a 17 kD band in the lanes of control T-cells and CAR-T cells. GAPDH was used as the internal reference. d. The expression of PSMA antigen in prostate cancer cells as assessed by Western blot. PSMA was around 100 kD. GAPDH was used as an internal reference. e. The expression of PSMA in LAPC-9,LNCaP and PC3 cells as analyzed by flow cytometry. f. Western blot was used to detect the content of TGF-β1 in the cell culture supernatant.