
Figure 2.
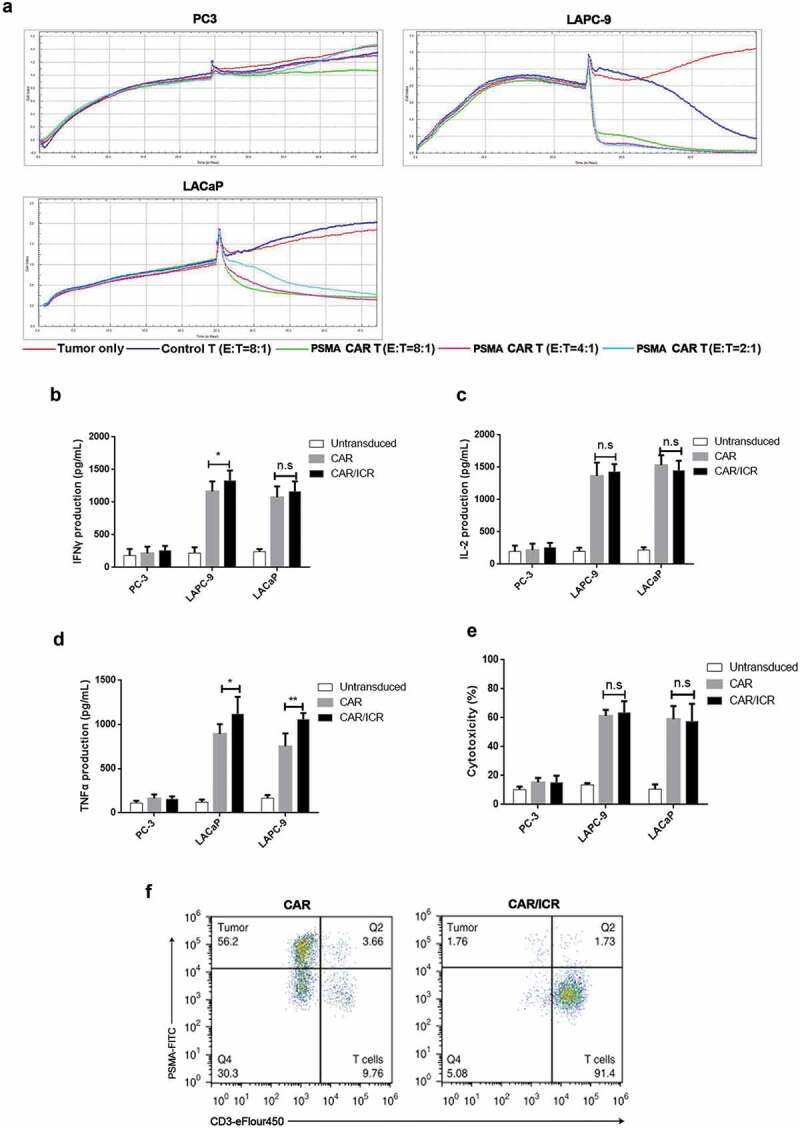
Effects of ICR on in vitro activation and cytotoxicity of PSMA-CAR-T cells.
a. Real-time cytotoxicity assay showed the proliferation of adherent cancer cells; each curve represented a well of cancer cells. Three different effector-target ratios were selected for PSMA-CAR-T cells (E: T ratio: 8:1, 4:1 and 2:1), while only one E: T ratio was chosen for the control T cells (8:1). At the initial stage, 1 × 10⁴ tumor cells were inoculated into each well for 24 hours of incubation. In the second stage, T cells or the media were added to corresponding wells for 24 hours of further incubation. b. 1 × 10⁴ target cells were co-incubated with effector cells at an effector-target ratio of 2:1 for 24 h, followed by the determination of secretion level of IFN-γ. (n = 3, bar value represents the dispersion degree, *, p < .05, **, p < .01). c. Determination of the secretion level of IL-2. (n = 3, bar value represents the dispersion degree, *, p < .05, **, p < .01). d. Determination of the secretion level of TNF-α. (n = 3, bar value represents the dispersion degree, *, p < .05, **, p < .01). e. 1 × 10⁴ tumor cells were co-incubated with effector cells at an effector-target ratio of 2:1 for 6 h, followed by measurement of the level of LDH in the supernatant to characterize cytotoxicity (n = 3, bar value represents the dispersion degree, *, p < .05). F. Representative flow cytometry dot diagram indicated the lysis of target cells induced by CAR-T cells after 3 rounds of tumor cell stimulation.