
Figure 3.
ICR enhanced the viability of PSMA-CAR-T cells after repeated in vitro stimulation of tumor cells.
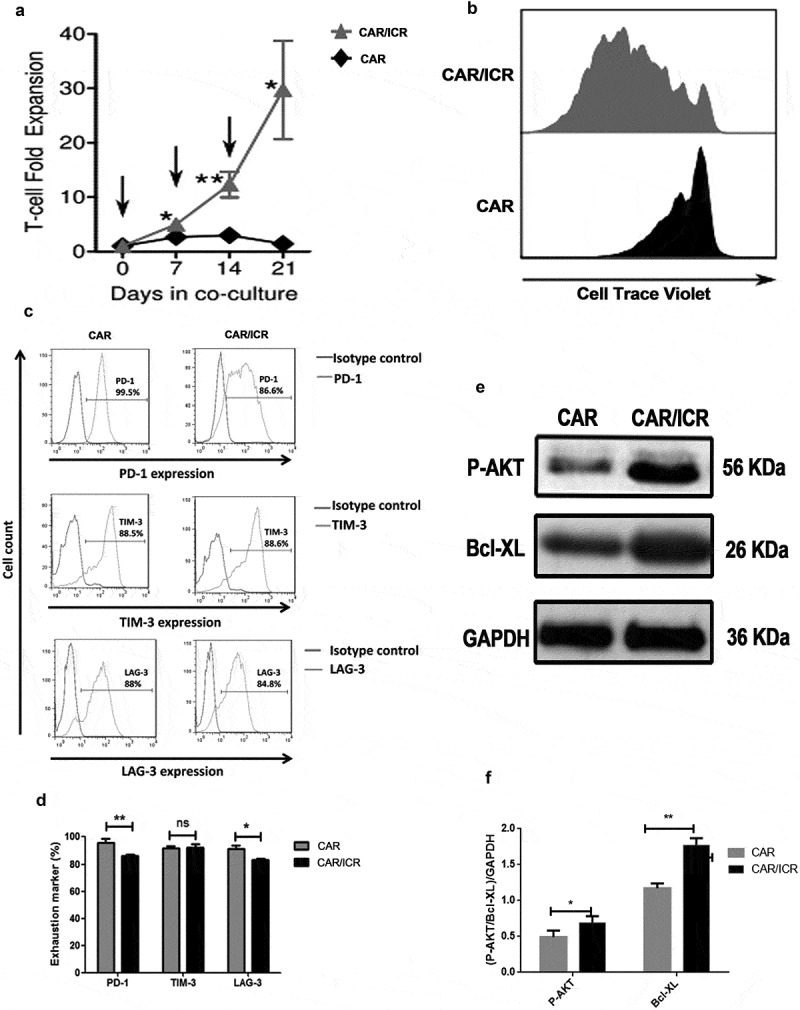
a. Cumulative amplification of PSMA-CAR-T cells or PSMA-CAR-T cells co-expressing ICR during continuous co-culture. The arrow indicated the time at which T cells were re-stimulated by tumor cells. b. For proliferation analysis, PSMA-CAR-T cells and PSMA-CAR-T cells co-expressing ICR were collected at the end of the second tumor cell stimulation and labeled with Cell Trace Violet, at the 4th day, cells were collected after the third stimulation for flow cytometric analysis. c. After three rounds of antigen-specific stimulation with LAPC-9 cells, flow cytometry was performed to determine the expression of biomarkers representing cell depletion on the surface of T-cells, including PD-1, TIM-3, and LAG-3 antibodies. d. Bar graph of PD-1, TIM-3 and LAG-3 expression (n = 3, bar value represents the dispersion degree, ns not significant, p > .05, * p < .05, ** p < .01, * ** p < .001). e. After three rounds of antigen-specific stimulation with LAPC-9 cells, T cells were isolated and subjected to Western blot for measurement of the expression levels of p-Akt and Bcl-xL. F. The bar graph showed the quantitative densitometry results of the protein levels of phosphorylated Akt and Bcl-xL. (n = 3, bar value represents the dispersion degree, * p < .05, ** p < .01).