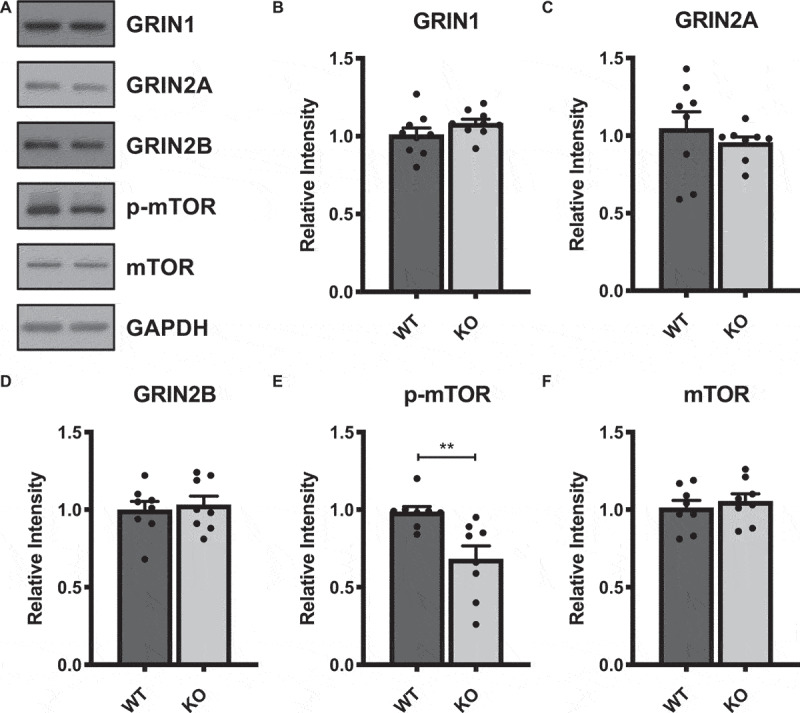
Figure 2.

Western blots from isolated synaptosomal fractions of dorsal hippocampus of CamK2Cre, Cav1.2KO mice and WT littermates reveal a decrease on phosphorylated mTOR expression. (a) Representative bands of NMDAR subunits (GRIN1, GRIN2A, and GRIN2B), S2448 phosphorylated mTOR (p-mTOR), and total mTOR protein levels taken from the same blot and adjacent lanes. (b-f) Quantification of relative intensities of respective bands, normalized to GAPDH expression levels.P-mTOR, t(14) = 3.201**p = 0.0064. Data are displayed as mean ± SEM.
