
Figure 5.
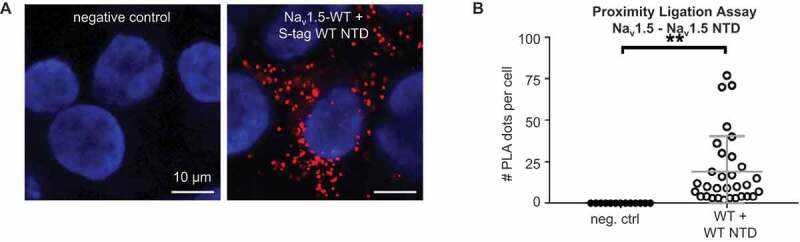
CaM interacts with Nav1.5 NTD. (a) Representative Duolink® PLA images of COS cells transiently transfected with WT S-tagged Nav1.5 NTD. Red dot signals were generated when full-length WT Nav1.5 is within 40 nm of WT or variant NTD. Nuclei stained with DAPI in blue. Scale bar, 10 µm. (b) Quantitative analysis of the PLA signals. Data are presented as mean ± SEM. **, p < 0.005.