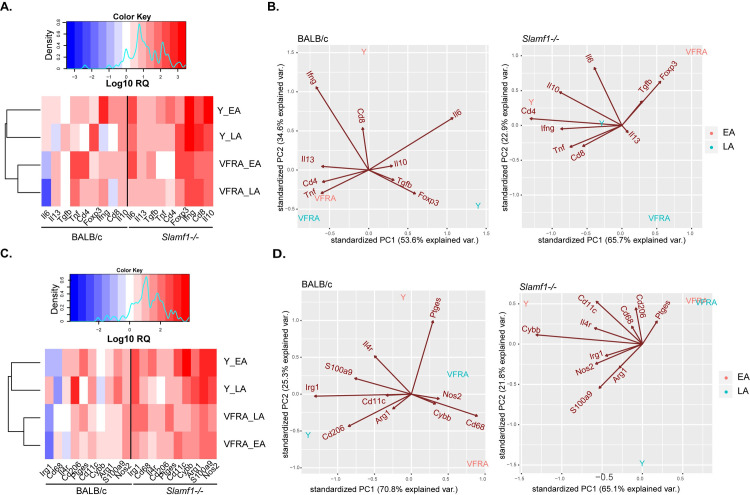
Fig 7. Gene expression in the intestine of BALB/c and Slamf1-/- mice infected with Y and VFRA strains of T. cruzi.
Gene expression was determined by RTqPCR and log RQ values were obtained after normalizing value from infected respect to non-infected intestines. Lymphoid population markers and cytokines heat map (A) and PCA analysis (B). Myeloid population markers and enzymes heat map (C) and PCA analysis (D). A color code was given from high (Red) to low (Blue) gene expression. Results corresponding to 5 mice per group are represented.

