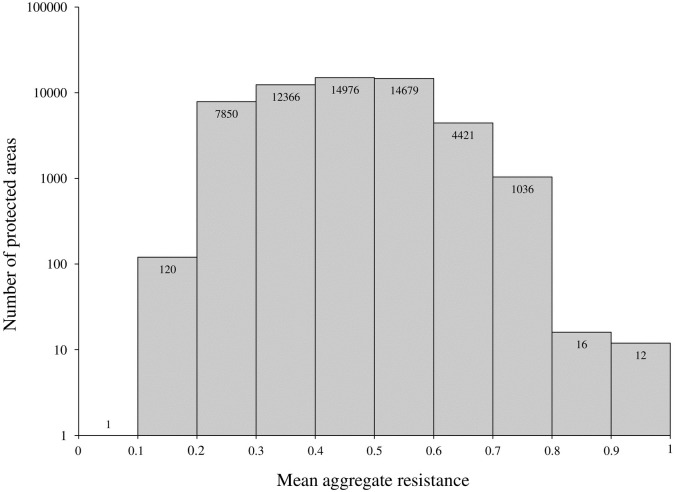
Fig 5. Aggregate focal species resistance within New England’s protected areas.
Mean aggregate resistance provides a standardized indicator of resistance for each protected parcel based on the average focal species resistance within the parcel. Graph displays trends in mean aggregate resistance within individual parcels.

